


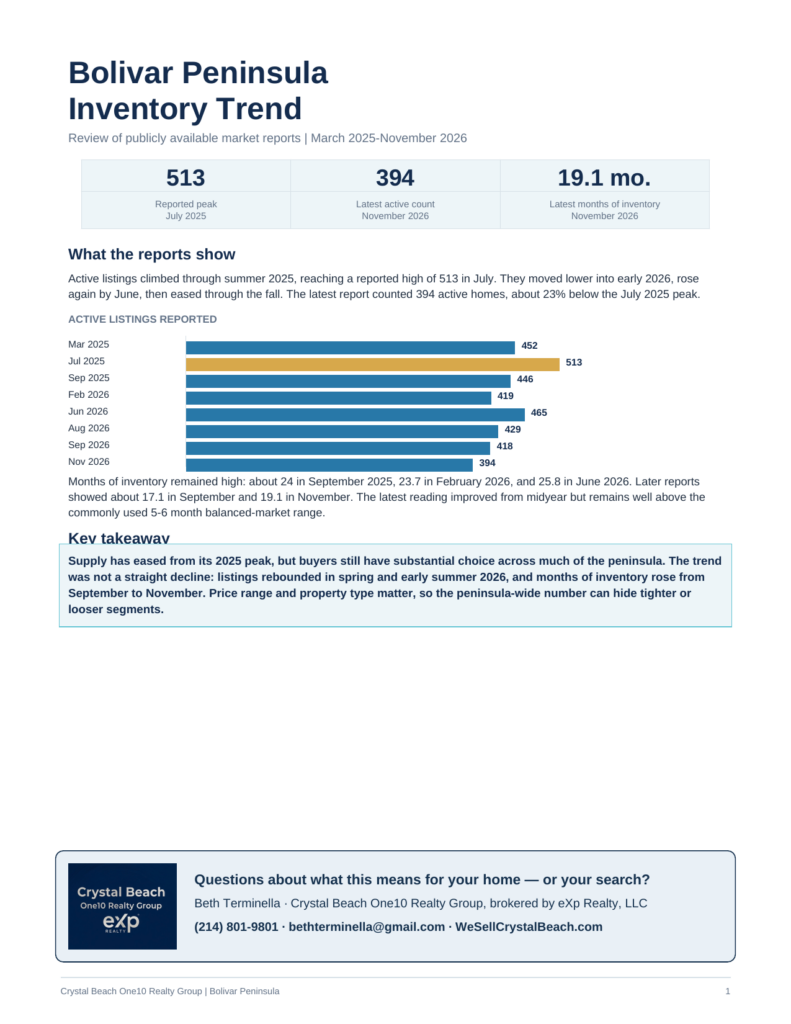
If you’ve been watching the Bolivar Peninsula market, you’ve felt it: lots of homes to choose from, and a pace that rewards patience and good pricing. We pulled every public market snapshot from March 2025 through November 2026 into one place, so you can see the whole trend — not just this month’s headline.
📄 Download the full report (PDF): Bolivar Peninsula Inventory Trend Report 2025–2026
The headline numbers
- 513 — reported peak in active listings, July 2025
- 394 — latest active count, November 2026 (about 23% below the peak)
- 19.1 months — latest months of inventory, November 2026
What the reports show
Active listings climbed through summer 2025, reaching a reported high of 513 in July. They moved lower into early 2026, rose again by June, then eased through the fall. The latest report counted 394 active homes.
Months of inventory stayed high the whole way: about 24 in September 2025, 23.7 in February 2026, and 25.8 in June 2026. Later reports showed about 17.1 in September and 19.1 in November. The latest reading improved from midyear but remains well above the commonly used 5–6 month balanced-market range.
The snapshot timeline
| Report snapshot | Active listings | Months of inventory | Movement |
|---|---|---|---|
| Mar 30, 2025 | 452 | Not stated | Spring baseline |
| Jul 2025 | 513 | Not stated | Reported peak |
| Sep 19, 2025 | 446 | 24 | Below summer peak |
| Feb 2026 | 419 | 23.7 | Continued easing |
| Jun 2026 | 465 | 25.8 | Midyear rebound |
| Aug 2026 | 429 | 21.2* | Easing from June |
| Sep 2026 | 418 | 17.1 | Further improvement |
| Nov 2, 2026 | 394 | 19.1 | Listings down; MOI up vs. prior report |
*August 2026 MOI is a HAR Crystal Beach area statistic; boundaries and definitions may differ from peninsula-wide snapshots.
How to read the trend
Active listings count homes available on a snapshot date. Months of inventory estimates how long that supply would take to sell at the recent pace. Months of inventory can rise while active listings fall if sales slow — that helps explain why November has fewer active homes than September but higher reported months of inventory (19.1 versus 17.1).
What it means for your home — or your search
Supply has eased from its 2025 peak, but buyers still have substantial choice across much of the Peninsula. The trend was not a straight decline: listings rebounded in spring and early summer 2026, and months of inventory rose from September to November. Price range and property type matter, so the peninsula-wide number can hide tighter or looser segments — your segment is the number that counts.
Selling? In a market with this much choice, your pricing and presentation have to earn a buyer’s attention from day one.
Buying? You have room to be selective — and in tighter segments, the good ones still move.
Get the full report
Download the full two-page report (PDF) — every snapshot, the sources, and how we read the trend: Download the Bolivar Peninsula Inventory Trend Report
For the month-by-month detail, read our November 2026 market update: November 2026 market update
Thinking about a beach house as a rental? See how short-term rentals work on Bolivar Peninsula
Questions about what this means for your home or your search? Contact our team: Beth Terminella, Mark DeSantis, or Liz Primeaux — (214) 801-9801.
Figures are approximate historical snapshots from publicly available report summaries and linked market updates (March 2025–November 2026); they are not a property valuation or appraisal. A strict year-over-year comparison should use consistent HAR MLS geography, property type, and snapshot definitions.